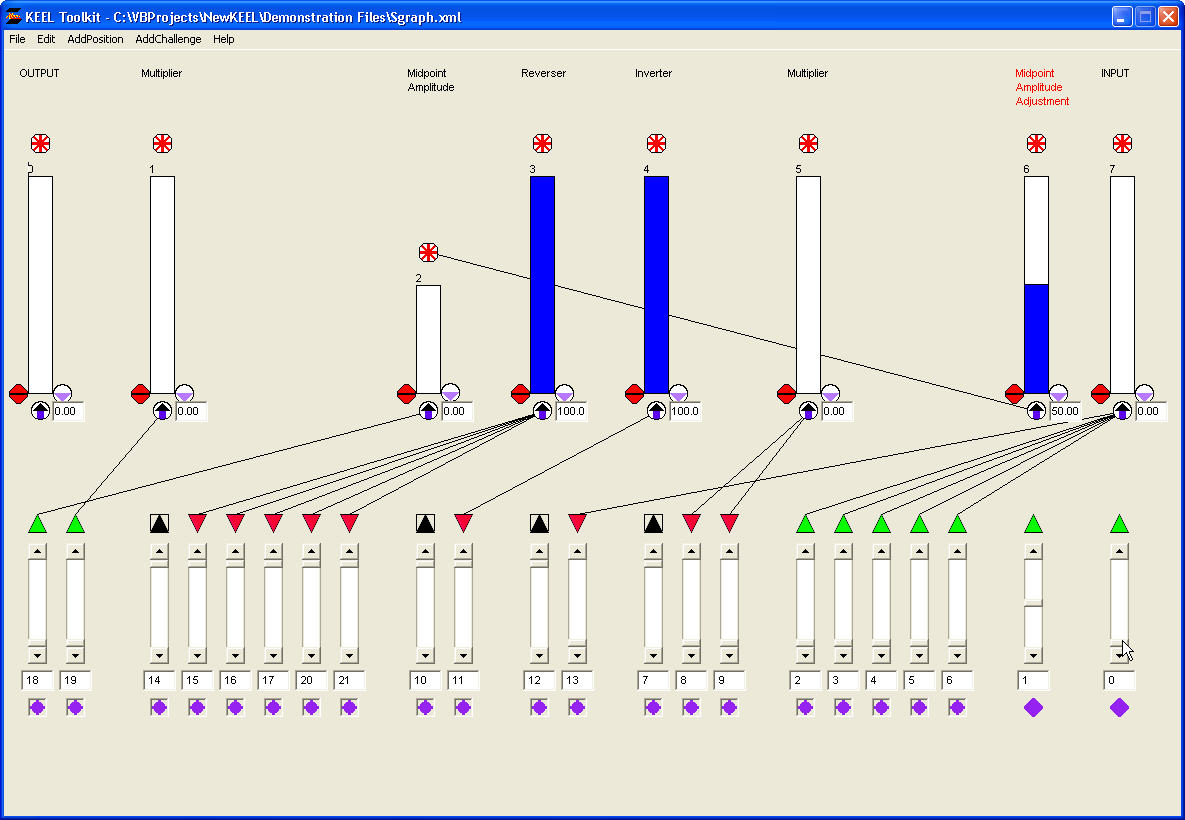
Sgraph.xml
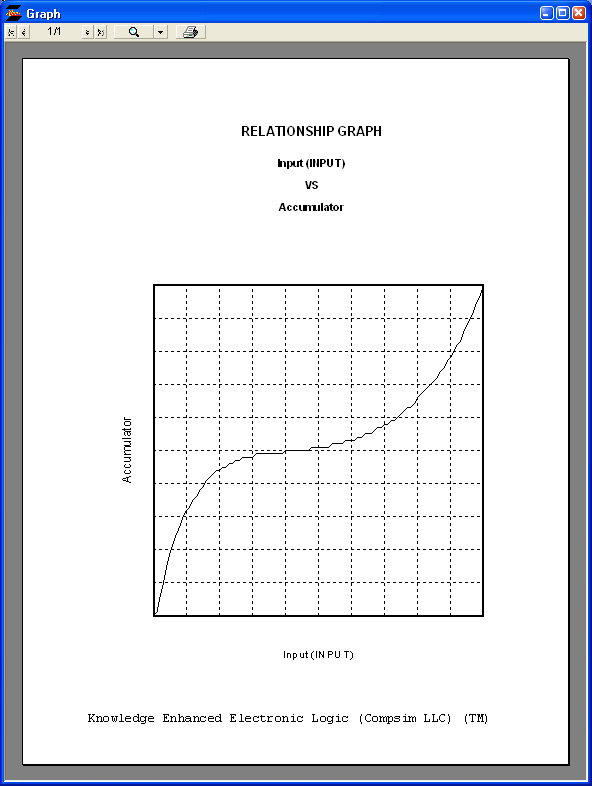
This is an accumulation of two curves: a convex curve whose slope goes from vertical to horizontal and is limited to a value defined by the "Midpoint Amplitude Adjustment" and a second curve whose slope goes from horizontal to vertical across the entire range of the "INPUT" modified value. With the "Midpoint Amplitude Adjustment" position set at 50%, the curve is symetrical as shown in the first graph.
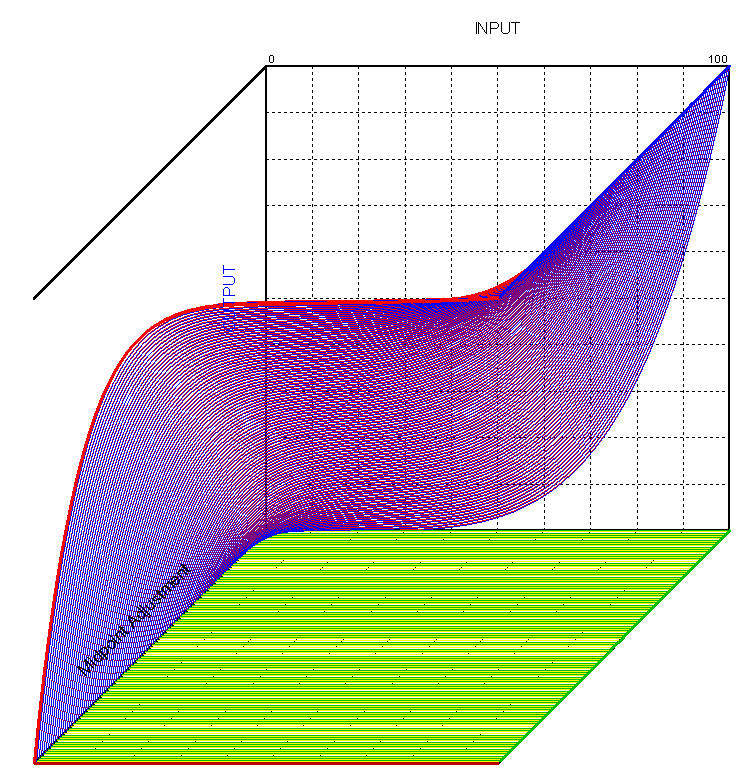
Because this graph shows the midpoint with an external input, we are able to change the shape of the curve. The second graph shows the shape changing from concave to convex.